Heatwaves loom as a growing threat to humanity in a warming climate. This summer alone, in the northern hemisphere, thousands have died during extreme heat events. It's driving researchers to find out more about the point when heat turns deadly.
The article is about an experiment, where people are exposed to 35°C wet bulb temperatures, but in different settings. Sometimes lower temperatures but higher humidity, sometimes vise versa, but always 35°C wet bulb temperature.
So far the assumption was, that humans can’t survive a 35°C wet bulb temperature for longer than 6 hours. And at current warming this is unlikely to be naturally the case within this century.
However the experiment gives hints to believe that humans can’t survive at lower wet bulb temperatures either. It looks like with lower temperatures and higher humidity, humans can get very close to that 35°C wet bulb temperature, however people seem to struggle more with higher temperatures and lower humidity.
A possible explanation could be, that while more sweat evaporates in lower humidity, the body has a limit for how much sweat it can produce. And if you keep raising the temperature, that the human body simply can’t produce enough sweat to cool itself.
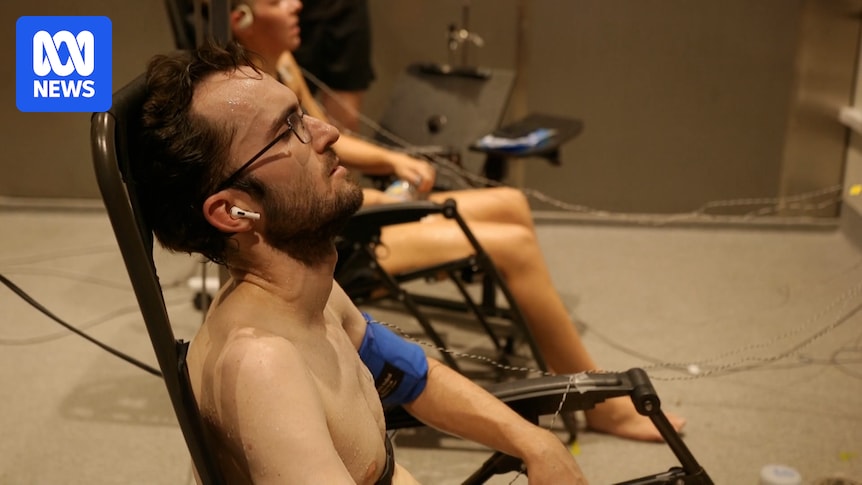
That’s pretty much what I took away from the article. They mentioned they experiment with several people, however the article was mainly about on person in the experiment, a 30ish year old, athletic male.
Edit: add some graphs from the article. Sorry for low quality, but as you said, the layout is quite atrocious and on my phone it keeps jumping around on it’s own, so I lost patience.


The article is about an experiment, where people are exposed to 35°C wet bulb temperatures, but in different settings. Sometimes lower temperatures but higher humidity, sometimes vise versa, but always 35°C wet bulb temperature.
So far the assumption was, that humans can’t survive a 35°C wet bulb temperature for longer than 6 hours. And at current warming this is unlikely to be naturally the case within this century.
However the experiment gives hints to believe that humans can’t survive at lower wet bulb temperatures either. It looks like with lower temperatures and higher humidity, humans can get very close to that 35°C wet bulb temperature, however people seem to struggle more with higher temperatures and lower humidity.
A possible explanation could be, that while more sweat evaporates in lower humidity, the body has a limit for how much sweat it can produce. And if you keep raising the temperature, that the human body simply can’t produce enough sweat to cool itself.
That’s pretty much what I took away from the article. They mentioned they experiment with several people, however the article was mainly about on person in the experiment, a 30ish year old, athletic male.
Edit: add some graphs from the article. Sorry for low quality, but as you said, the layout is quite atrocious and on my phone it keeps jumping around on it’s own, so I lost patience.
Thanks. Especialy for the graphs. My browser did not like the site!.
It is not your browser, this site is just bad🤧
Is the dashed line the old model?
As I understood it, the dashed line is just the 35°C wet bulb temperature line.
I think it’s the “old assumed border of survivability” and don’t know if it is based solely on mathematics or on other experiments as well.
I also don’t know on how many individuals the new line is based and what age group the older people one is.